Best car infotainment system 2026: what the data shows
Search for the best car infotainment system in 2026 and plenty of headlines promise a winner. The actual data tells a narrower story. The 2026 U.S. Multimedia Quality and Satisfaction Study, published by J.D. Power roughly a month ago, doesn't name a single standout system or crown a "most satisfying car infotainment system" anywhere in its public release. It reports industry-wide findings only, and those findings describe a category that is, by its own measure, sliding backward relative to the rest of the car even as individual features inside it get better.
The headline number is stark: multimedia accounts for 25% of all reported vehicle problems, based on a survey of 78,514 owners of 2026 model-year vehicles (The Drive, 1 month ago). Infotainment is also the only major vehicle category found to worsen year over year, even as overall new-vehicle quality improved, and it now includes the five most frequently reported problems in the entire study (The Drive, 1 month ago). That's the tension worth sitting with: multimedia-related problems were essentially unchanged year over year at 42.4 problems per 100 vehicles, yet the category's share of everything owners complained about kept climbing (just-auto, 1 month ago). This piece breaks down what the 2026 data actually measures, why that split happens, and how to evaluate a car's infotainment system yourself given that no named winner is currently public.
How the 2026 study measures infotainment quality
Video of the Day
J.D. Power surveyed owners 90 days after purchase or lease (The Drive, 1 month ago). That timing shapes how everything else in the study should be read. A 90-day window is built to capture how a system feels during onboarding, not how it performs over years of ownership. It simply doesn't extend far enough to say whether a system still works well after a software update or a new phone enters the picture.
The study is also U.S.-only, covering purchasers and lessees of 2026 model-year vehicles sold in the American market (just-auto, 1 month ago). Infotainment hardware, map data, and voice assistants can differ by market, so these findings describe American buyers' early experience, not a global verdict on any given system.
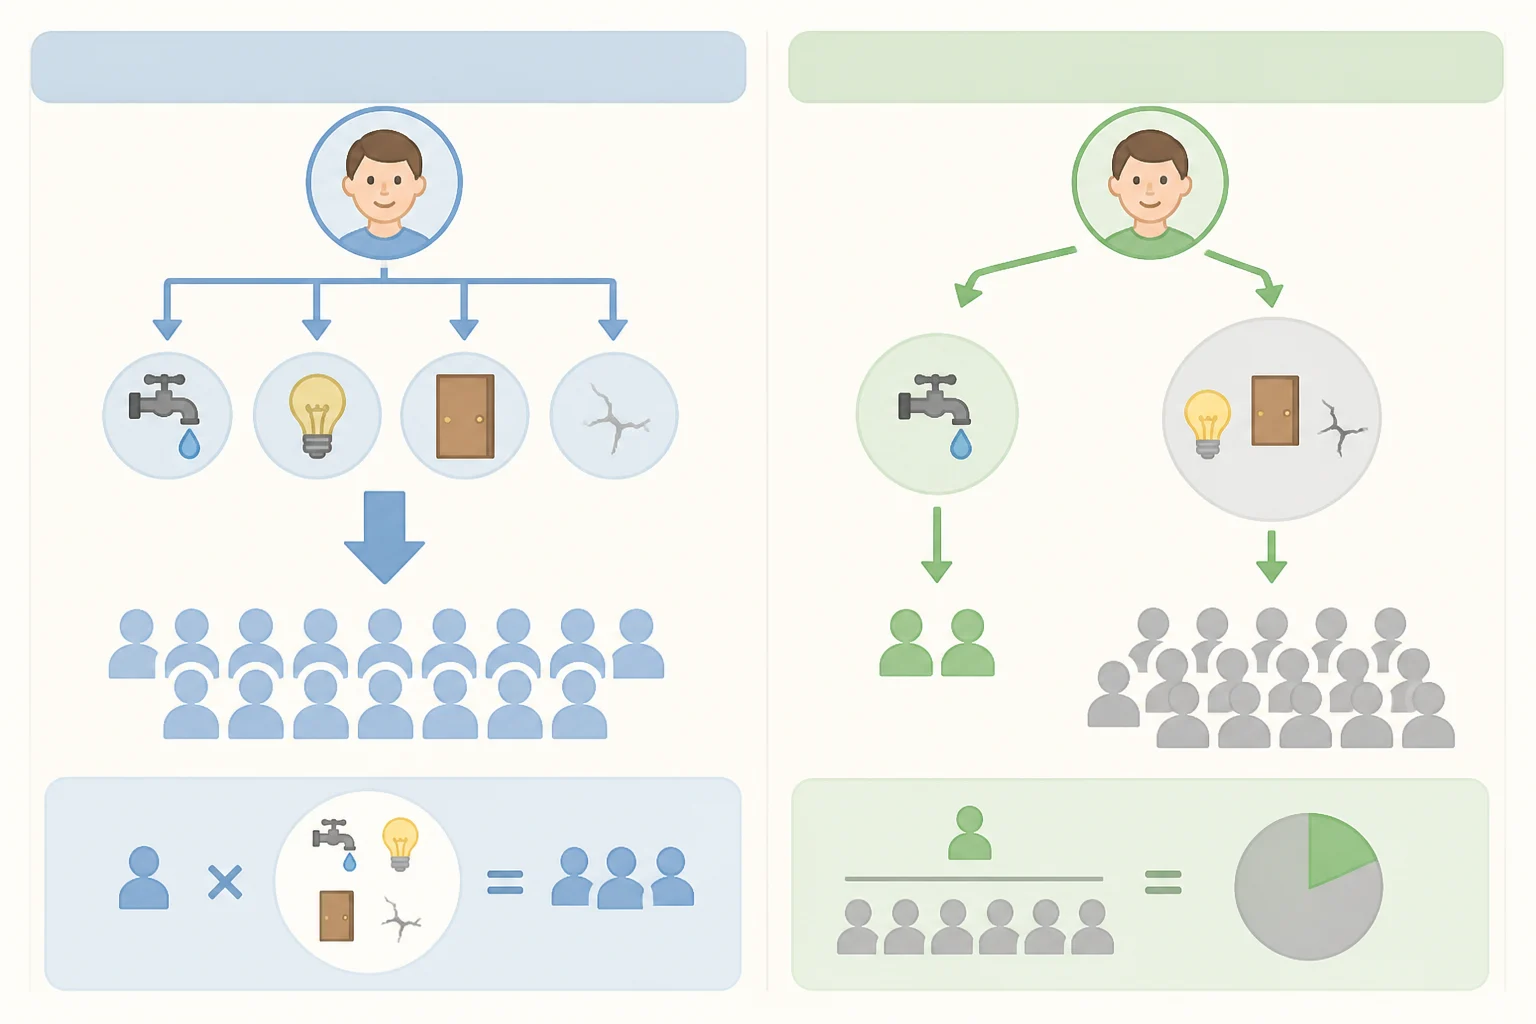
The core metric is 42.4 problems per 100 vehicles, or PP100, for multimedia (just-auto, 1 month ago). It helps to work through what that number actually represents. PP100 counts reported problems per 100 vehicles surveyed, not the share of owners who experienced at least one issue. A single frustrated driver who complains about a laggy screen, a dropped Bluetooth connection, and a navigation glitch contributes three problems to that count, not one. So a PP100 of 42.4 doesn't mean roughly 42% of owners had a complaint; it means the rate of logged problems, however they're distributed across owners, works out to that figure per 100 vehicles. That rate now makes up a quarter of every problem logged across every vehicle category in the study, from engine issues to seat comfort to infotainment.
That distinction, problem rate versus share of total problems, is the key to reading every other claim in the study correctly. It's also what makes the central finding sound contradictory until you sit with it: infotainment got worse by this measure, while its own raw complaint rate barely moved.
Video of the Day
Why infotainment keeps losing ground even as it improves

Multimedia PP100 held essentially flat at 42.4 year over year. Its share of reported vehicle problems still rose to 25% (The Drive, 1 month ago). A simple way to picture this: if total complaints across every category fell from, say, 160 per 100 vehicles to 130 per 100 vehicles, and multimedia's own 42.4 stayed exactly where it was, multimedia's slice of that shrinking pie grows automatically, even though nothing about multimedia itself changed. That's consistent with other categories improving while this one stayed put, dragging its relative weight upward. The study doesn't break out exactly which other categories improved or by how much, so this is an inference supported by the math rather than a claim stated outright.
The broader framing treats this as a byproduct of an industry still finding its footing on the software side of the car: overall vehicle quality keeps climbing, but multimedia is the one major category still sliding backward (just-auto, 1 month ago). That's J.D. Power's own read on its data, not an independently verified cause. But the shape of the numbers is at least consistent with it: a flat problem count paired with a rising share looks exactly like what you'd expect if automakers have gotten better at the mechanical side of a car while software keeps finding new ways to annoy people.
The frustrating part for automakers is that specific functions are demonstrably getting better. Navigation satisfaction rose 17 points year over year to 933 on a 1,000-point scale, with fewer complaints about usability and route accuracy, and satisfaction also improved tied to speaker performance (just-auto, 1 month ago). None of that progress has yet dented infotainment's overall share of complaints, though. PP100 and satisfaction scores are two different metrics tracking two different things: one counts problems, the other measures how owners feel about specific features. They're moving somewhat independently here, which means isolated fixes are working without resolving the category's broader quality gap. The data doesn't explain why that gap persists, and treating it as a settled story would be getting ahead of the evidence.
What the 2026 J.D. Power multimedia quality and satisfaction study can tell shoppers
The release has three practical limits for shoppers. It identifies infotainment as an industry-wide quality risk (The Drive, 1 month ago). It does not support naming any single car the best vehicle multimedia system, since the public release reports industry-level findings rather than a model-level winner. And its 90-day survey window reflects early-ownership impressions, not years of use, which is worth weighing even without J.D. Power itself framing it as a stated limitation.
It's worth being precise about what the public data doesn't rule out, too. The 2026 release examined here reports industry-level findings; that's different from saying no model-level results exist anywhere. It simply means they weren't part of the material published in this release, which leaves shoppers in the position of having a clear warning about the category but no scoreboard to check it against.
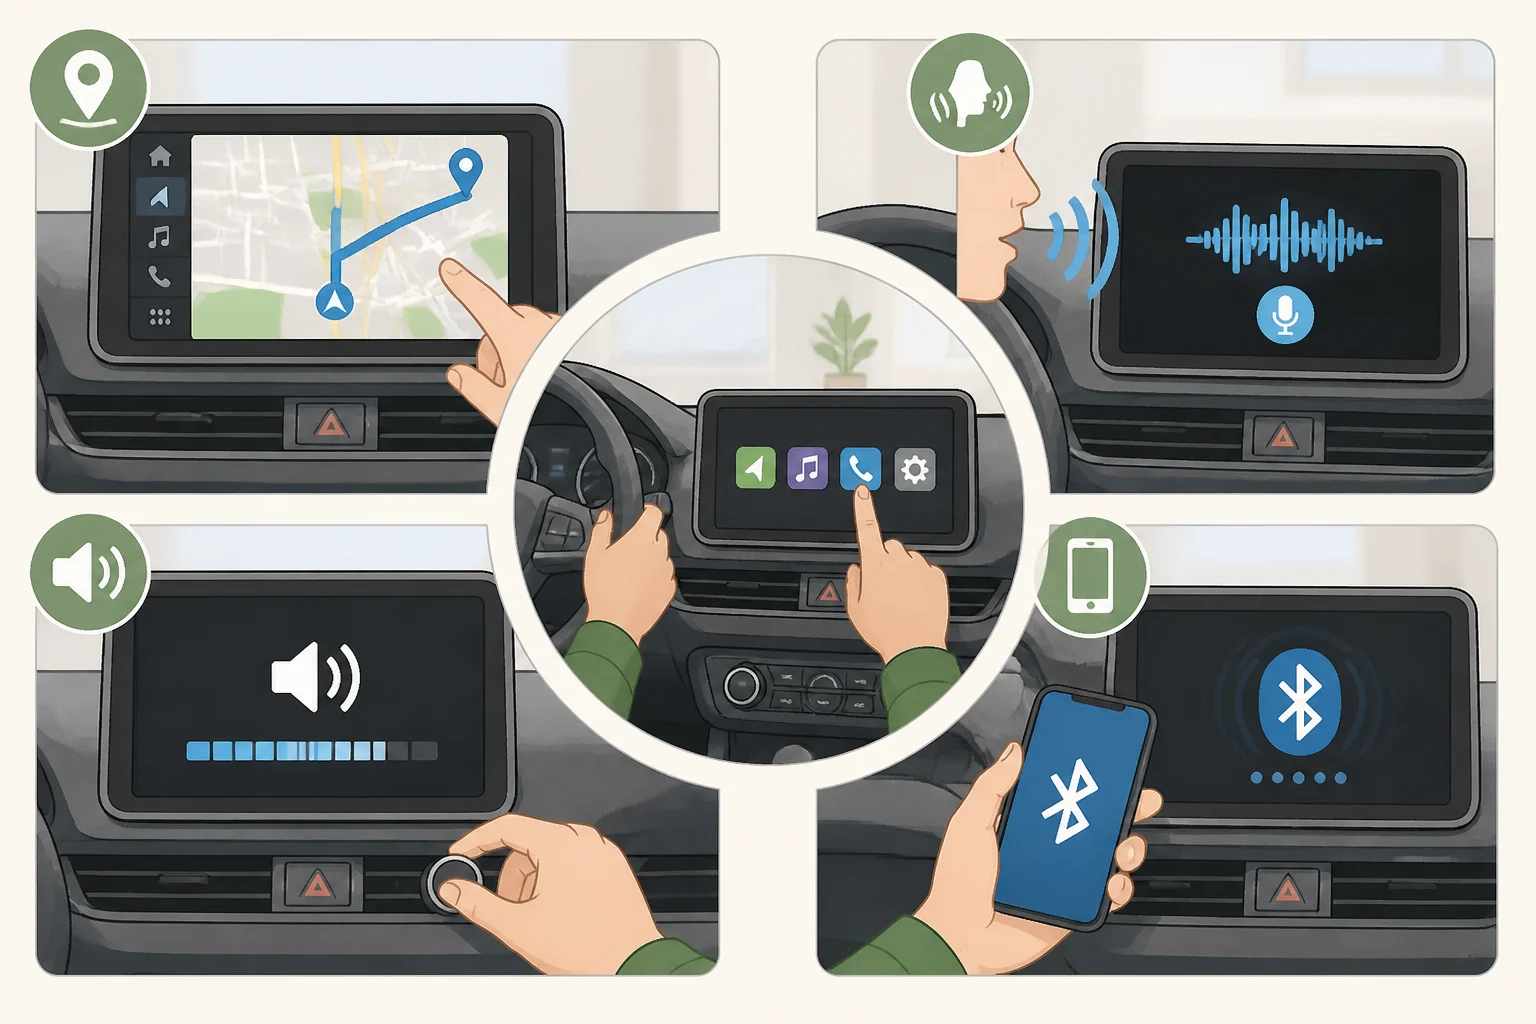
Given that gap, testing a system directly in the trim being purchased beats waiting on an award that may or may not materialize. Build a short routine around the categories actually discussed in the data. Run navigation on a route that isn't already memorized, since that's the function shown to improve most this year. Work through voice commands for tasks that would actually get used, like changing climate settings or placing a call. Check volume consistency switching between a podcast, the radio, and a phone call. Pair a phone more than once to see how wireless CarPlay or Android Auto behaves on reconnection; treat that last check as sensible precaution informed by the study's connectivity findings, not a function it separately scored.
If segment-level results for 2026 eventually surface, a few ground rules make them useful rather than misleading. Compare vehicles only within their own class, since a midsize SUV's infotainment system isn't competing with a compact sedan's. Confirm the exact trim and software version being reviewed matches what's actually for sale, since infotainment hardware and software can vary across trims of the same model. And read any award as a signal about early-ownership satisfaction, not a guarantee the system stays trouble-free for years, given the 90-day survey window behind it.
What would actually resolve the uncertainty
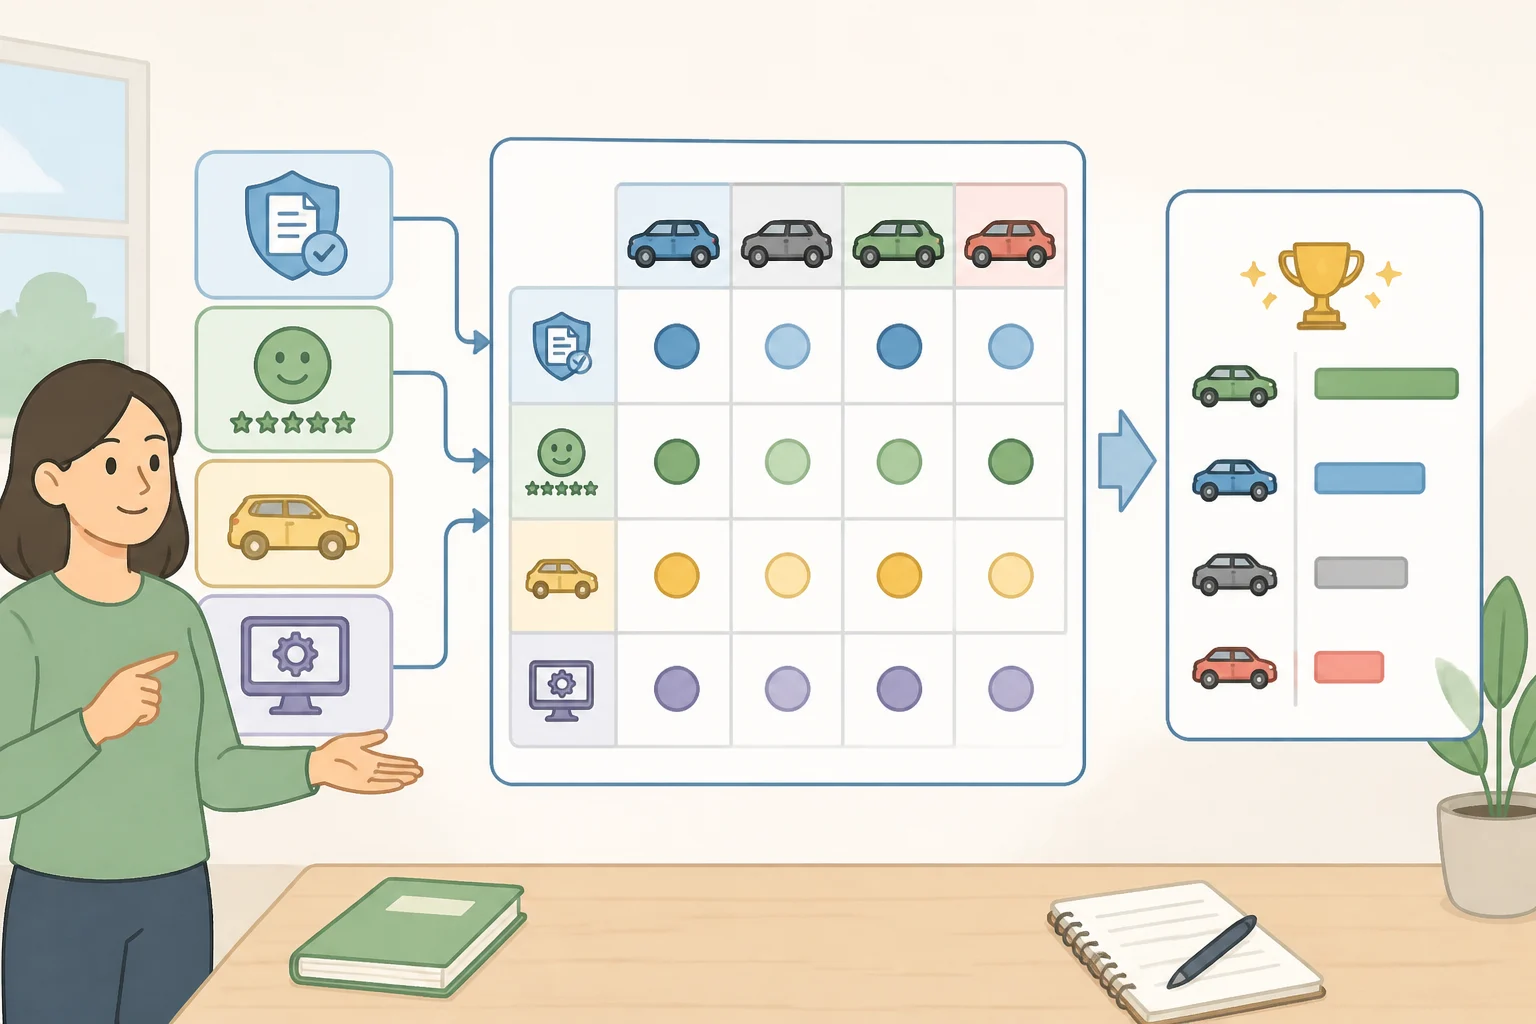
A few specific disclosures would turn this from an informed guess into a clear picture. Model-level PP100 and satisfaction scores, if published for 2026 the way infotainment studies have broken things out before, would finally let shoppers compare systems directly instead of inferring quality from a single industry-wide number. Sample sizes by model matter too; a strong result built on a handful of respondents carries a different kind of confidence than one built on thousands.
Knowing exactly which trim and software version each score reflects would also close a real gap. Infotainment varies enough within a single model lineup that a base trim's system and a top trim's system can behave like two different products, and the current public data doesn't separate them.
The figure most worth tracking next year isn't another isolated gain like navigation's 17-point jump. It's whether multimedia's 25% share of total problems finally falls instead of holding steady or climbing again. A decline there would suggest the industry has started addressing the software complexity behind today's numbers, rather than patching individual features one at a time while the category's overall weight keeps growing. A flat or rising number, on the other hand, would mean the pattern seen in this year's study is becoming the industry's new normal rather than a temporary rough patch.
Until that next round of findings arrives, the more reliable approach for anyone shopping right now is hands-on: test navigation, voice control, and connectivity directly in the trim being bought. The real competition in infotainment isn't which automaker adds another screen. It's which one makes the software behave the same way every single day, without the owner having to think about it.