Google Earth 7.1.2 includes an Elevation Profile that provides elevation details at any chosen point along a path that you draw. Create a path using Earth's Path tool, and then display the Elevation Profile. Earth also displays the elevation of the location of your cursor on the map, in the lower right corner.
Step 1
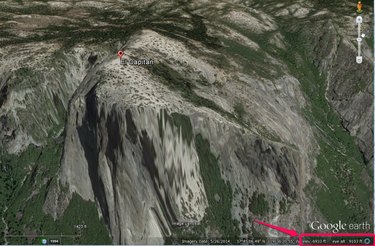
Open Google Earth and navigate to the location you want either manually by zooming in, or by searching for a location. If you searched for a location the elevation of the specific point displays at the bottom right of the window. The "elev" number indicates the elevation of the selected point; the "eye alt" number is the altitude of your vantage point. The "eye alt" number changes if you tilt the view.
Video of the Day
Step 2
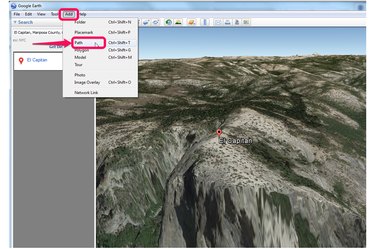
Create a path to view the elevation of points along a particular route: Click "Add," and then "Path" to open the New Path dialog.
Step 3
Enter a name for your path in the "Name:" field. The cursor becomes a square when placed over the map while the New Path dialog box is open.
Step 4
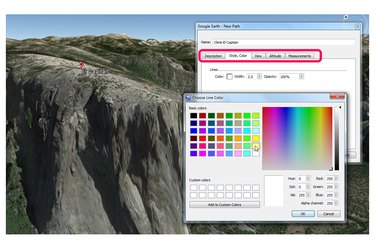
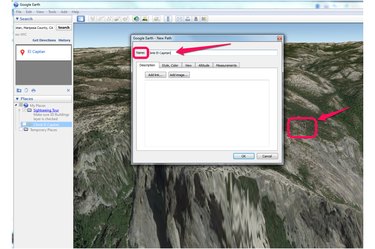
Customize the path. Click the "Style, Color" tab to choose a different line color or width. The default line color is white and the default width is 1.0 point. In some terrain, the path line may be difficult to see on the map, so increase the width and change the color to make the path more visible when drawn. Click the "Description" tab to add a description of your route. Select the "View" tab and then click on the drop-down menu next to Date/Time: to add a Time stamp or Time span to your path. Choose the base altitude for your route by clicking the "Altitude" tab and making the appropriate selections. Click "Measurements" to change the units. Don't click "OK" in the New Path dialog box yet. You must first draw the path.
Step 5
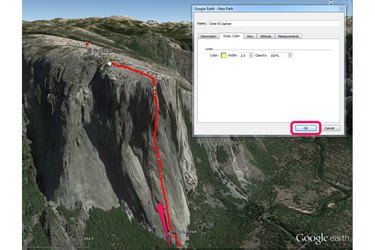
Draw the path using your cursor. You may need to drag the New Path dialog box out of the way or zoom in for greater precision when you trace your route. Instead of dragging, you can also click on a spot to add a point, click on another spot to add another point and so on, creating a route that follows a series of points. Release the mouse button when you've completed the route and click "OK" to close the New Path dialog box and display the path.
Step 6
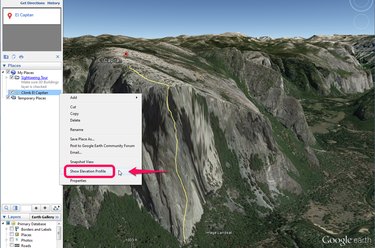
Open the Elevation Profile by right-clicking on your path name in the left sidebar and selecting "Show Elevation Profile" or clicking on the "Edit" menu and selecting "Show Elevation Profile."
Step 7
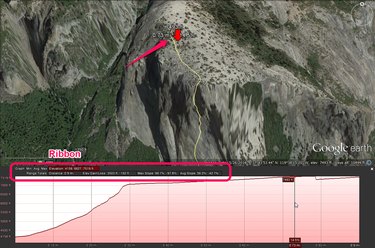
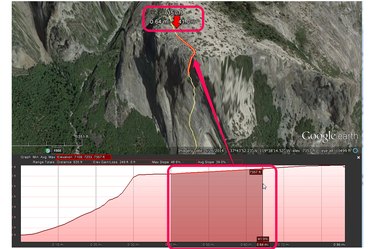
View your path's elevation details. The chart's Y axis displays the elevation, and the X axis reflects its distance. Place your cursor at any location inside the Elevation Profile graph to view details for that location. Click or drag your cursor across the graph to view details for any point on the path. As your cursor moves through the graph, the three numbers near the red arrow on the map change to reflect specifics for the location of your cursor on your path.
The number above the red arrow reports elevation at the selected location, the left arrow distance traveled at that point in the path, and the right arrow the path's grade at the selected location. For example, at the point of the cursor in the image, the elevation is 7493 feet, the distance traveled at that point on the path is 0.73 miles, and the path's slope, or grade, is 14.5%.
The ribbon above the graph reports additional data, including the minimum, average and maximum elevation in the red box to the left, and below that, the total distance, the elevation gain or loss, and the maximum and average slope, or grade.
Step 8
Analyze a section of your path by dragging your cursor across a portion of the Elevation Profile while holding down the left mouse button. This creates a darker area on the Elevation Profile and isolates that section on the path, which displays with a red border. The selected section's specific data displays, both in the path itself and in the profile: the red arrow on the map moves to the selected highest point and the ribbon displays updated metrics.
Video of the Day