Making graphs and charts is Excel's specialty, but you don't need to switch between programs to insert a line graph into a Word 2013 document. Make the graph right from Word using the Insert Chart feature, which provides the same graphing tools as Excel itself.
Step 1: Insert a Chart
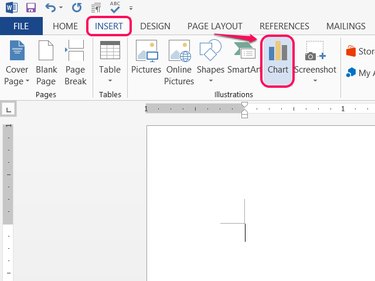
Open the Insert tab in Word and click Chart.
Video of the Day
Step 2: Pick a Style
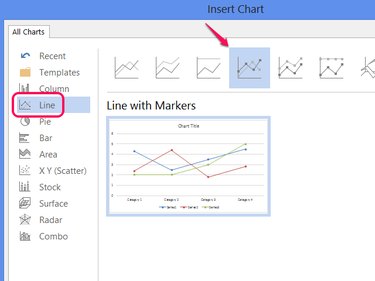
Select Line and pick one of the styles to set the chart's appearance. Click OK to create a line graph.
Step 3: Build the Chart
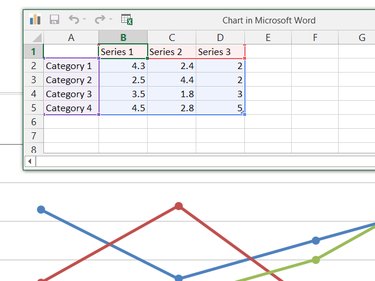
Edit the data in the Chart in Microsoft Word window to build the graph. Unlike creating a chart in Excel, Word starts out with a ready-made sample chart, so edit the existing series labels, categories and values in the spreadsheet to turn the sample chart into your own.
Step 4: Add Chart Elements
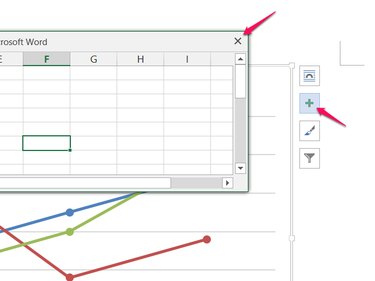
Close the spreadsheet when you're finished editing the data, and then click the + icon to add or remove other chart elements, such as labels, legends, titles or gridlines.
Step 5: Edit an Existing Chart
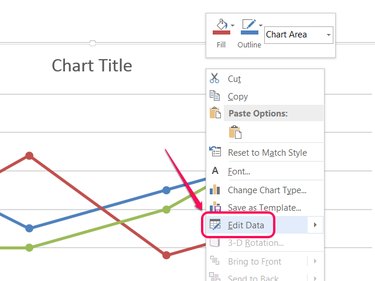
Right-click your chart and choose Edit Data to reopen the data spreadsheet for editing later. Changes you make to the spreadsheet take effect on the graph immediately.
Video of the Day