How to Explain Local Housing Market Conditions to Buyers: A 3-Step Method
If you want to know how to explain local housing market conditions to buyers, start with the homes they can actually afford not the metro-wide inventory count that bears no relationship to their budget. This guide walks through a repeatable three-step method for reading a local market before a buyer consultation, one that replaces headline statistics with the numbers buyers are actually responding to.
The core argument is simple: rising inventory is not the useful signal. Affordability alignment is.
Spring contract signings just hit a four-year high, but a Realtor.com report published this week attributes that directly to sellers pricing realistically, not to inventory volume. A joint NAR and Realtor.com Housing Mismatch Report, also out this week, found that the national Listing-Income Alignment Score sits at 74.9% as of March 2026, up from 66.7% a year ago but still well below the pre-pandemic baseline of 84.4%. Nearly every major market is moving in the right direction. The gap between where listings are priced and where buyers can afford to buy remains wide in most of the country.
The buyer in your office isn't asking how many homes are for sale. They're asking whether any of those homes make financial sense for them. The three steps below prepare you to answer that.
Step 1: How to explain local housing market conditions to buyers using budget-band inventory
Video of the Day

The communication task: Replace the headline listing count with the number of active listings in the buyer's specific price range and how that number has been trending.
The gap between total inventory and affordable inventory is not cosmetic. The NAR/Realtor.com Mismatch Report found that households earning around $75,000 a reasonable middle-income benchmark can currently afford roughly 23% of listings nationally. In a balanced market, that same household would access approximately 44% of what's available. Getting from 23% to 44% requires about 311,000 additional listings priced below $261,140. For buyers earning $50,000, roughly 9% of listings fall within reach. At $100,000, it's 39%.
The mismatch isn't simply a supply shortage. It's a dual constraint: not enough homes overall, and too much of what exists concentrated at price points where fewer buyers can compete. As the report notes, inventory at entry-level and middle-market tiers is structurally scarce while listings targeting upper-income buyers are relatively abundant. More listings coming to market does not automatically mean more options for the buyer in front of you.
What to do:
- Before the consultation, filter active listings in your MLS to the buyer's target price range. Note the total count.
- Within that range, flag how many had price reductions in the last 30 days and the approximate size of those reductions.
- Open the meeting with that number, not the metro total. "There are 42 active listings in your range right now, and 11 have had price cuts in the past month" (figures used here as illustration) tells a buyer something actionable. "Inventory is up 12% year over year" tells them almost nothing about their situation.
Gotcha: Buyers who've absorbed national headlines about rising inventory may expect far more options than exist at their price point. Set that expectation before they've spent two weekends disappointed. Show the math, then move forward.
Video of the Day
Step 2: Diagnose whether your market is aligned or misaligned and name it clearly
The communication task: Use local alignment data to tell buyers whether the mismatch they're experiencing is structural and unlikely to resolve soon or directional, shifting meaningfully in their favor.
Not all constrained markets are the same kind of constrained. NAR and Realtor.com's alignment scoring illustrates the range. The five most income-aligned major markets Toledo at 107.4%, St. Louis at 106%, Akron at 105%, Pittsburgh at 102.6%, and Detroit at 102.4% are concentrated in the Midwest, where home prices bear a realistic relationship to local incomes. At the other end, Los Angeles scored 39.4%, San Diego 45%, and Boise 53.2%. In those markets, the mismatch is structural. The buyer is not dealing with a temporary imbalance; they're dealing with a market that has been functionally inaccessible to middle-income households for years.
A third category deserves its own label: markets actively rebalancing. Lakeland, Florida improved its alignment score by 18.3 percentage points year over year. Las Vegas gained 14 points. Cape Coral-Fort Myers added 13. These markets aren't balanced yet, but the trajectory matters. Nearly all 100 major markets tracked showed improvement or held flat over the past year, with Madison, Wisconsin the rare exception, according to NAR. Broad improvement is real. Improving and fixed are not the same thing.
What to do:
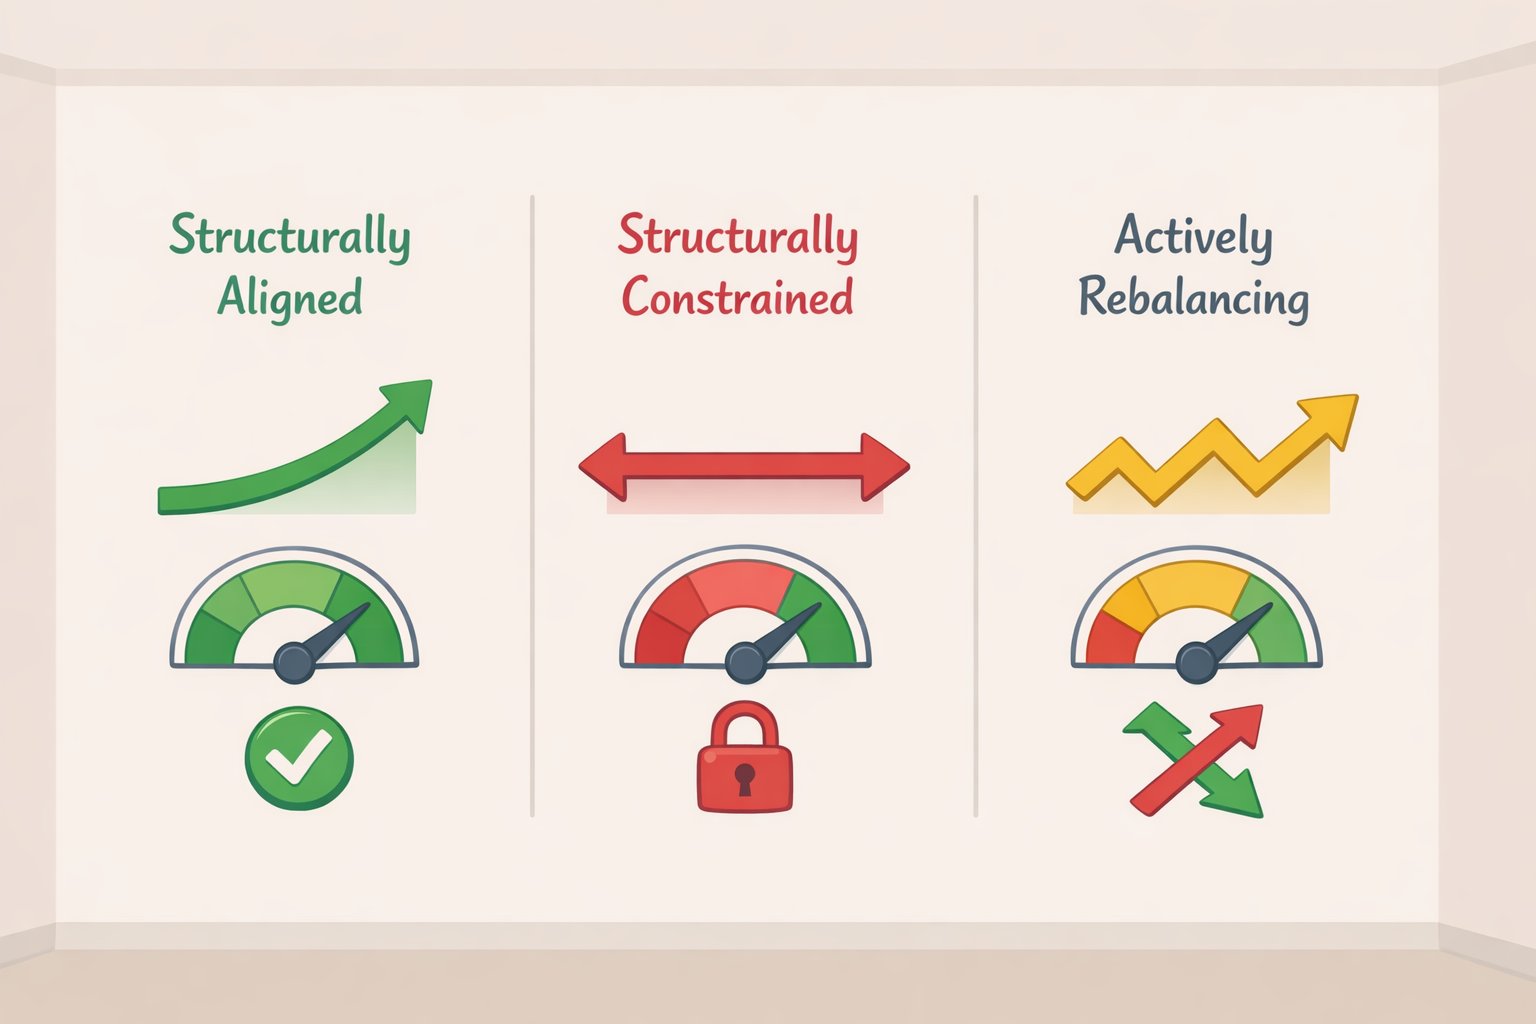
- Characterize your metro in one of three ways: structurally aligned, structurally constrained, or actively rebalancing. You don't need a precise score you need a directionally accurate description.
- For aligned markets: tell buyers they're operating in a market where pricing reflects reality. Competition exists, but the math is workable for a buyer at their income level.
- For constrained markets: name the structural gap directly. "Homes at your price point are genuinely scarce here not because there's no inventory, but because most of what's listed is priced for buyers earning significantly more than you." Buyers who feel like the market isn't working for them are often right. Naming it clearly builds credibility.
- For rebalancing markets: show the trend line. Month-over-month price reductions and rising days on market are your evidence. Acknowledge that improvement doesn't mean resolved.
Gotcha: Don't conflate macro improvement with local resolution. The NAR Mismatch Report is explicit: rising supply has not translated into stronger sales because so much of that new inventory lands outside what buyers can pay and that's true even before accounting for mortgage rate lock-in. Telling a buyer things are "getting better" without the local context can erode trust the first time they see what's actually available.
Step 3: Use pricing signals to show buyers where the market is actually moving

The communication task: Translate your market diagnosis into live local indicators price cut frequency, days on market by price tier, contract-to-list ratios that show buyers which listings represent real transactions and which are noise.
Buyers aren't primarily waiting for more homes to appear. They're waiting for evidence that sellers have accepted the same market reality they're living in. When that alignment happens, buyers move. Realtor.com's spring data makes this concrete: Jacksonville and Austin are both classified as buyer's markets, conditions that usually discourage seller activity. Yet Jacksonville posted a 5.2% year-to-date gain in contract signings and Austin 7.6%, both despite falling new listing counts. The sellers who came to market in those cities priced aggressively enough to convert buyer interest into signed contracts. Where seller pricing stayed stubborn, transaction activity did not follow inventory higher.
NAR's latest existing-home sales data adds useful behavioral context: days on market are lengthening, and while multiple offers still occur, they're less intense than in prior years. Buyers are patient and selective, evaluating concrete fit price, terms, negotiating room rather than speculative future appreciation.
What to do:
- Pull the percentage of active listings in the buyer's price tier that have had price reductions in the past 30 to 45 days, and the median reduction size. These figures are illustrative benchmarks to track directionally, not fixed thresholds what matters is whether the trend is moving toward buyers or away from them in your specific market.
- Check average days on market for that price tier specifically, not the overall market. A listing sitting well above the median buyer budget for that area is a mismatch signal, not a market-wide indicator.
- Look at recent contract-to-list ratios for closed sales in the range. Ratios below 100% suggest buyers have some negotiating room; ratios at or above 100% indicate competition persists even in a broadly soft market. Your MLS data will tell you where that line sits locally.
- Summarize for the buyer in plain terms: "In your price range, a meaningful share of listings have had cuts in the last month, time on market is running longer than the metro average, and recent closings are coming in below list price. That's a workable market." Use your actual numbers the structure of that sentence is the point.
Gotcha: Don't present these numbers without the budget-band filter from Step 1. A market can simultaneously have intense competition at $450,000 and significant buyer use at $280,000. Aggregate stats will mislead buyers in both directions.
The pre-meeting diagnostic: what to pull before every buyer consultation
Before each consultation, gather these five data points. Together, they answer the question buyers are actually asking.
| What to Pull | What It Tells You |
|---|---|
| Active listings in buyer's price band | Whether real options exist at their budget |
| % of those listings with price cuts (last 30-45 days) | Whether sellers are adjusting to market reality |
| Direction and size of those price cuts | How aggressively sellers are moving |
| Average days on market for that price tier | How selective and patient buyers currently are |
| Recent contract-to-list ratio for closed sales in range | How much negotiating use buyers actually have |
In an aligned or rebalancing market, these numbers will show movement and opportunity. In a structurally constrained market, they'll show scarcity and that's the conversation to have before the buyer tours their first home.
What changes in your next buyer consultation
Run this method in sequence: budget-band inventory first, market alignment diagnosis second, live pricing signals third. Each step builds on the last. What it produces isn't a data dump it's a conversation structure.
The national picture is genuinely improving. Alignment scores are up across nearly all major markets, and the Housing Affordability Index reached 110.6, up from 101.4 a year ago, according to NAR. But the national picture is not the local picture. The gap between Toledo at 107.4% alignment and Los Angeles at 39.4% per NAR isn't academic it determines whether your buyer's timeline is realistic or needs recalibrating.
The NAR Mismatch Report is clear on this: more supply alone will not restore a functional market. Recovery depends on supply expanding at the right price points, particularly in entry-level and middle-market segments. Until that happens, buyers who feel locked out are not misreading the market.
So arrive prepared. Put together a one-page brief organized by budget-band inventory count, your market's alignment status, and current pricing pressure in that tier. Walk in with those three things and you shift the consultation from a general market overview which buyers can get anywhere to a specific, honest assessment of their situation. That's the difference between an agent who reports the news and one who helps a buyer decide what to do about it.