Break-even analysis determines the point at which total costs of production are equal to total revenues for a product or service. A break even computation can be simple or it can be complex. It all depends on the number and detail of the cost and revenue factors you wish to include. Excel can perform the calculations required to help you determine the sales quantity at which the revenues and costs are near equal and break even.
Step 1: Enter Your Data
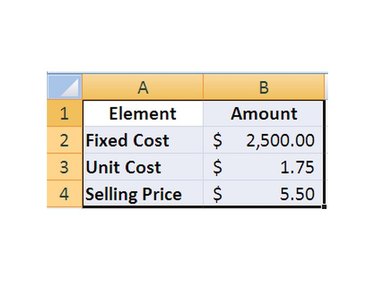
Open a New Excel workbook and enter the data needed to perform a break-even analysis: Fixed Costs, Variable Costs and Sales Price. You may have other costs you wish to add, which is fine. Just keep in mind the type of each cost when it is included in a formula.
Video of the Day
Step 2: Project Cost and Revenue
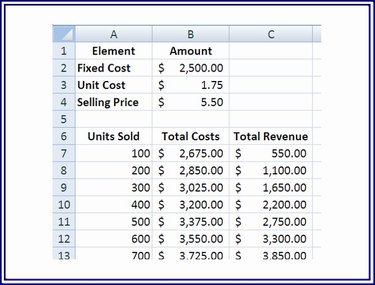
In another area of the worksheet, enter numbers to represent different quantities sold for modeling purposes. For each quantity, compute the total cost of production and the total gross revenue. The formula for the total costs is =(QuantityVariable Cost) + Fixed Cost, or as an example: =A7$B$3+$B$2. The formula for the total revenue is =Quantity * Sale Price, or as an example: =A7*$B$4. Copy these two formulas and paste them in the cost and revenue cells for each quantity in the model or use the Fill handle on the lower right corner of a cell to drag the formula into the other cells.
Step 3: Highlight the Data
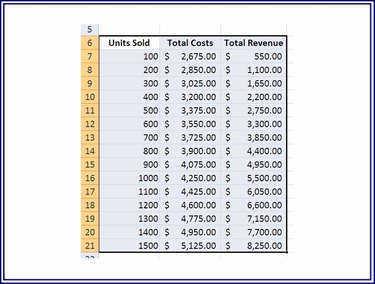
In the Economics world, the break-even point occurs when revenues equal costs. To begin creating a chart that shows lines for revenues and costs, highlight the three columns -- the quantity ("Units Sold"), cost ("Total Costs") and revenue ("Total Revenue") data generated in the previous step. To do this, click the mouse on the heading of the quantities (or "Units Sold" in the example) and while holding the left mouse button down, drag down to the revenue ("Total Revenue") of the last entry.
Step 4: Create A Break-even Chart
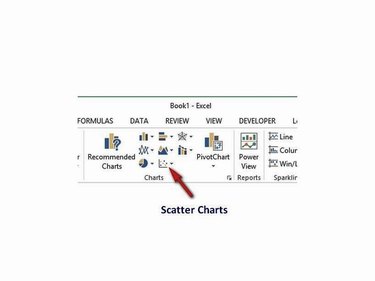
Select the Insert tab and click on the Scatter Charts icon in the Charts group. From the Scatter Chart gallery, choose one of the line charts: Scatter Chart with Straight Lines or Scatter Chart with Smooth Lines. Choose the "Marker" type charts to mark each of the data points.
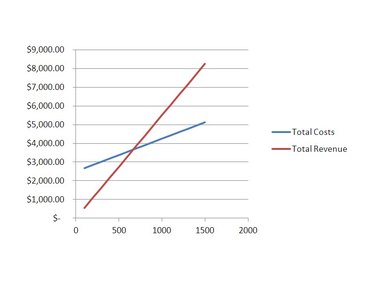
The chart that displays shows graphically where revenues and costs are equal, which is the point at which breakeven occurs.
Video of the Day