The coefficient of variation is a statistical measure of the distribution or dispersion of data around mean. This measure is used to analyze the difference of spread in the data relative to the mean value. Coefficient of variation is derived by dividing the standard deviation by the mean.
Step 1
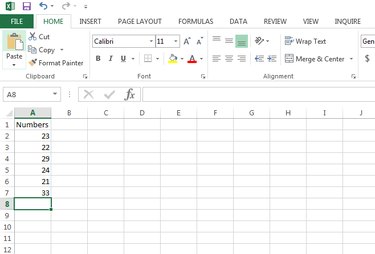
Identify the set of numbers for which the coefficient of variation is to be calculated. Enter the data on the Excel sheet. This example uses cells A2:A7, but your Excel file may use other cells.
Video of the Day
Step 2
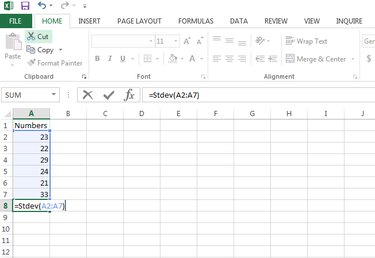
Use the function Stdev (number1, [number2],…) to calculate the standard deviation in Microsoft Excel. Input the formula =Stdev (A2:A7) for this example -- but enter your actual cell usage in your Excel file -- in a blank cell and press Enter to calculate the standard deviation.
Step 3
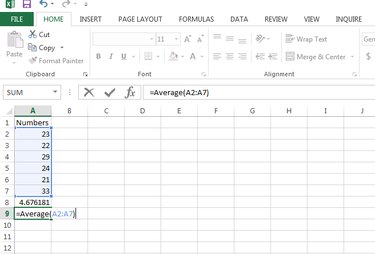
Use the function =Average(number1, [number2],…) to calculate the mean in Microsoft Excel.
Step 4
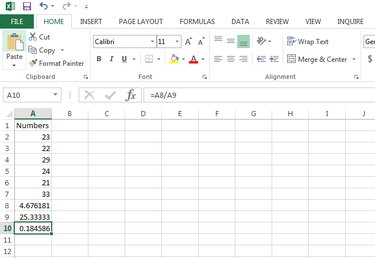
To find the coefficient of variation, input the formula =A8/A9 for this example or your actual range in a blank cell and press E**nter** to calculate the coefficient of variance.
Video of the Day