Making a pie chart in Photoshop can be as easy as dissecting a circle, or even a photo of an apple pie with the Lasso Tool. However, this can be a challenge if you want to create a pie chart that actually reflects the data you're illustrating, like 10, 15, or 20-percent segments. To create an accurate pie chart, use a 10-by-10-inch canvas and draw vertical strips representing the percentages in your chart. When you transform these stripes using the Polar Coordinates filter, you will get a pie chart with the segment sizes you need.
Step 1
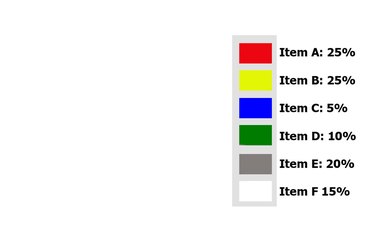
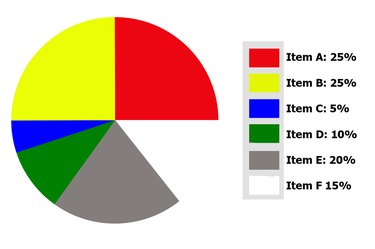
Write down the percentages needed for your pie chart. If you make a color-coded key to the chart first, you can use these colors for each segment of the pie simply by sampling them with the Eyedropper Tool.
Video of the Day
Step 2
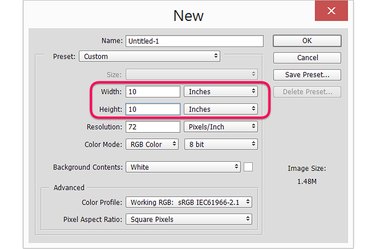
Press "Ctrl-N" to create a new file. Make the width and height each 10 inches. Each inch across represents 10 percent of your pie chart. A half-inch represents 5 percent. Click "OK." If the rulers aren't visible, enable them by selecting "Ruler" from the View menu. Click the "New Layer" button at the bottom of the Layers panel.
Step 3
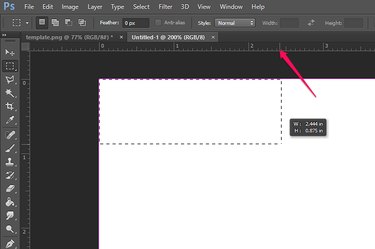
Select the "Rectangular Marquee Tool" from the Toolbox. Drag the cursor down and across from the upper-left corner of the canvas while watching the cursor's position in the top ruler. If the first pie segment is 25 percent, then make the first selection 2.5 inches wide, while ensuring it goes all the way from the top to the bottom of the canvas.
Step 4
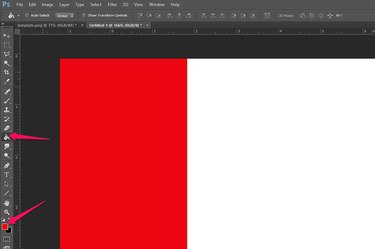
Click the "Paint Bucket Tool" in the Toolbox and select the first section's color in the "Foreground Color" icon at the bottom of the Toolbox. Click the selected area on the canvas to color it, then click "Deselect" under the Select menu.
Step 5
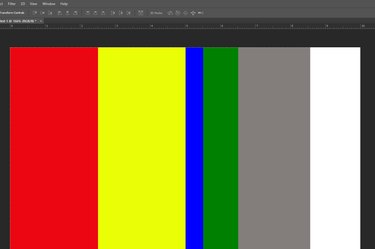
Drag the cursor from the edge of the first stripe to create the second segment and fill this selection with a different color. Repeat the process until you have all 100 percent -- or 10 inches across -- accounted for.
Step 6
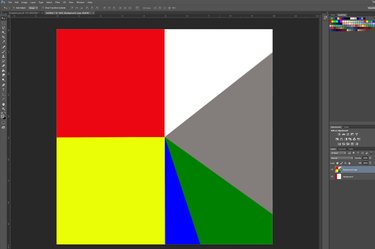
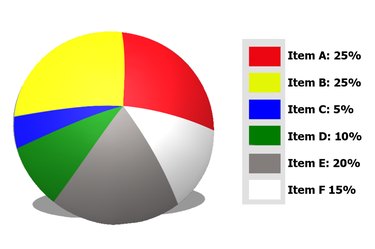
Click the "Filter" menu, select "Distort" and click "Polar Coordinates." At its default settings, the Polar Coordinates filter converts the rectangular stripes into polar representation. This essentially looks like a square pie chart, with the stripes becoming chart segments. Click "OK" to apply the filter.
Step 7
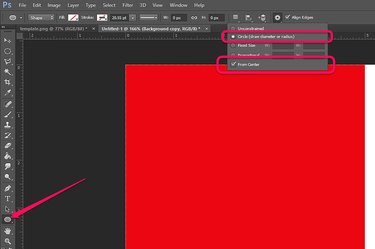
Select the "Ellipse Tool" from the Toolbox. Click the gear-shaped "Settings" icon in the Options bar and select "Circle" and "From Center."
Step 8
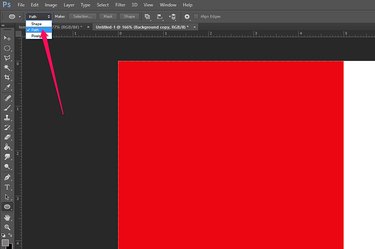
Click the menu that says "Shapes" in the Options bar and select "Path." Using a Path will allow you to easily turn the circle you draw into a selection.
Step 9
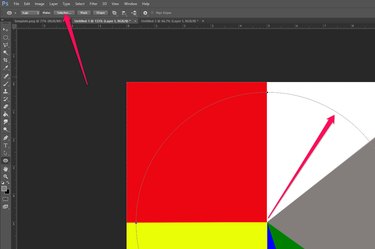
Drag the cursor from the center of the segments towards the edge. Make sure you don't go beyond the square's border. Click the "Selection" button in the Options bar to open the Make Selection dialog box.
Step 10
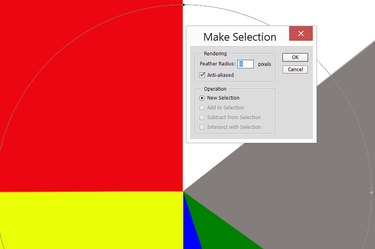
Click "OK" to use the Make Selection dialog box's default settings. This selects the circle created by the Ellipse Tool. Select "Inverse" from the Select menu to reverse the selection.
Step 11
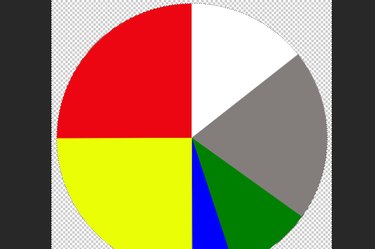
Press "Delete." Everything outside of the circle is trimmed away, leaving you with a pie chart. Press "Ctrl-A" to select the chart, then "Ctrl-C" to copy it.
Step 12
Open your Photoshop project requiring a pie chart and press "Ctrl-V" to paste the pie chart onto the canvas as a new layer.
Step 13
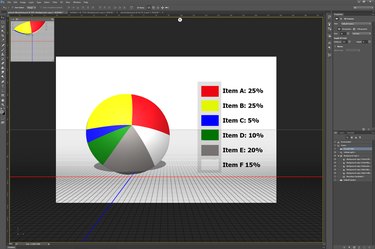
Apply any effects or layer styles to the pie chart you desire. For example, to have the pie chart stand out from the background, apply a Drop Shadow from the Layer Style options under the Layer menu. To make a 3D pie chart, click the "3D" menu, select "New 3D Extrusion From the Selected Layer" and adjust the settings as needed for the effect you want to create.
Video of the Day