Like Excel, a chart that you create in Word 2013 normally has the X-axis along the bottom of the chart and the Y-axis along the left. To move either of these or both to the center, change the Axis Options.
Creating an XY Chart in Word
Step 1
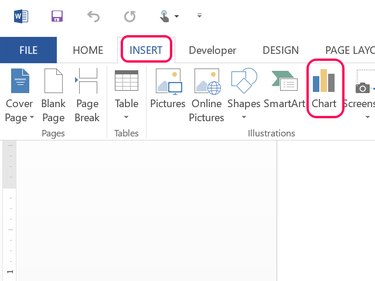
Open any Word document and click the Insert tab. Click the Chart icon that appears in the Insert ribbon.
Video of the Day
Step 2
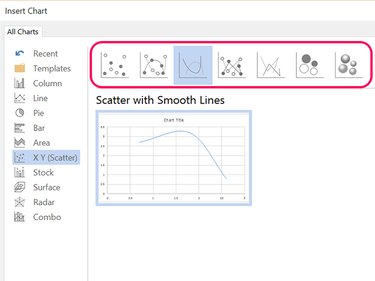
Click the X Y (Scatter) chart category and then choose any chart that displays at the top of the Chart window. A preview of the chart appears when you click a thumbnail. Click OK.
Step 3
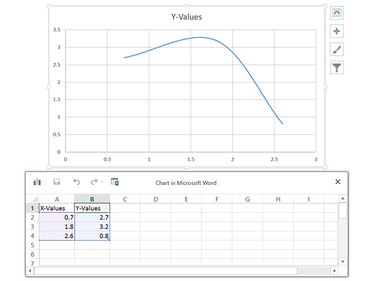
Enter your data in the Excel-like worksheet that displays. As you change the data, the chart changes as well.
Centering the Axis
Step 1
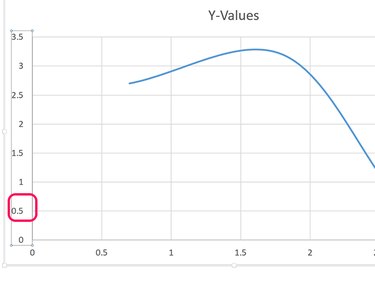
Double-click any number in the Y-axis to center the X-axis in the chart. The Format Axis menu opens with the Axis Options section already selected.
Step 2
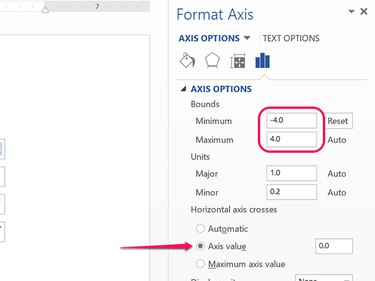
Change the Minimum Bounds value to the negative of what the Maximum value is. For example, if the Maximum value is 4.0, set the Minimum value to -4.0. This centers the X-axis along the Y-axis.
Alternatively, change the Horizontal Axis Crosses option from Automatic to Axis Value and then enter the number that is halfway between the current Minimum and Maximum Bounds values. For example, if the Y-axis range is from 0 to 4, entering 2 centers the X-axis along the Y-axis.
Step 3
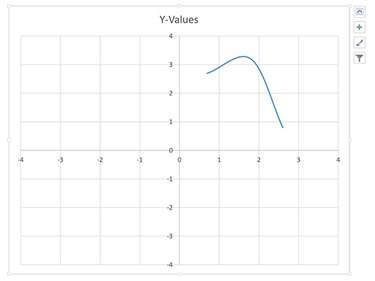
Double-click any number in the X-axis to center the Y-axis in the chart. Either change its Minimum Bounds value to the negative of its maximum, or change the Horizontal Axis Crosses to a value halfway between the Minimum and Maximum Bounds values.
Video of the Day