A coordinate system, or Cartesian coordinate system, is a useful tool for plotting points or lines in a four-quadrant chart. Using an X Y (Scatter) chart in Word 2013, create your own coordinate system with the points already plotted, or a blank system that you can print for later use.
Step 1
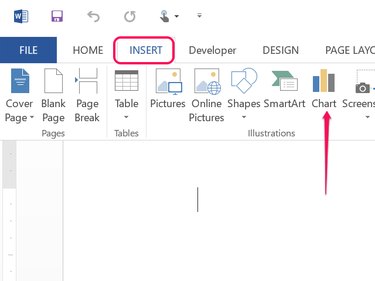
Click the Insert menu and then click the Chart icon.
Video of the Day
Step 2
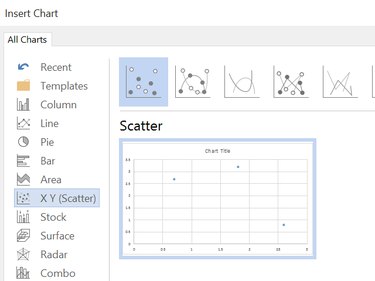
Select the X Y (Scatter) chart. The first, default, chart is the easiest to work with when you want a blank coordinate map, or if you want to plot points on the coordinates.
Step 3
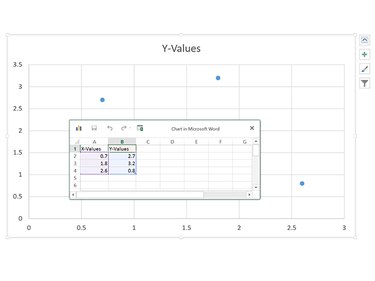
Click OK to accept the default XY (Scatter) chart. The chart opens on the Word page, as well as an Excel-based worksheet. Note that the numbers in the worksheet not only determine where the markers appear in the chart, but also determine the chart's range. Because there are no negative numbers in the default worksheet values, the chart's X and Y coordinates begin at 0.
Step 4
Enter the coordinates you want plotted in the chart by changing the numbers in the X-values and Y-Values columns. You can add as many values as needed.
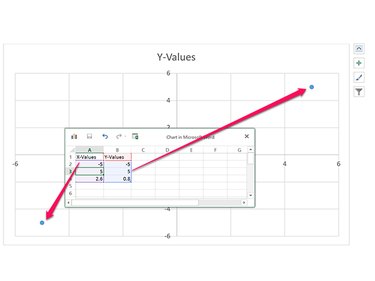
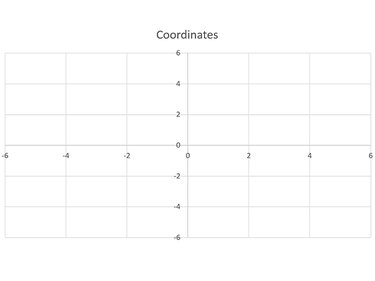
If you want a blank chart, change the first row of numbers to the smallest numbers that you want displayed in the range. Change the second row of numbers to the largest values to be displayed. For example, if the first row is -5 and -5, while the second row is 5 and 5, the chart's X and Y range will both be -6 to 6, with the zero-intersect appearing in the center.
Click the X in the worksheet window to close it.
Step 5
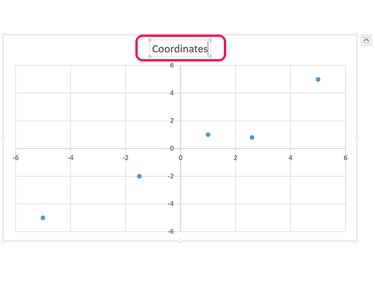
Change the chart title by clicking the Title text box. If you don't want a title, press Delete to remove it.
Step 6
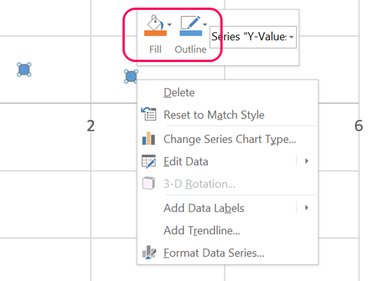
Right-click any coordinate point on the chart. If you want a blank coordinate system without any points, click the Outline icon and select No Outline from the drop-down menu. Right-click the point coordinate again, click the Fill icon and select No Fill.
Step 7
Save the Word document. The coordinate system chart will be saved as well.
Video of the Day